Best-Worst function
To apply any of functions like:
§
Best
§
Best in sum
§ Best in N% MDX TopPercent,
§
Worst
§
Worst in sum
§
Worst in N%
MDX BottomPercent
for element function you need to
§ … select with mouse desired element (one row) and right-click with mouse
§ … select Element functions menu
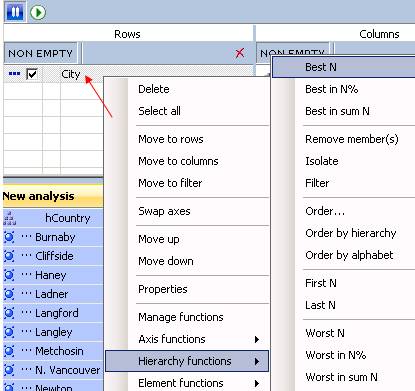
for hierarchy function you need to
§ … right-click over member that belongs to desired hierarchy
§ … select Hierarchy functions menu
for axis function you need to
§ … right-click inside row or column area
§ … select Axis functions menu
then select
§ … any Best or Worst function from submenu
In our case let us try to define:
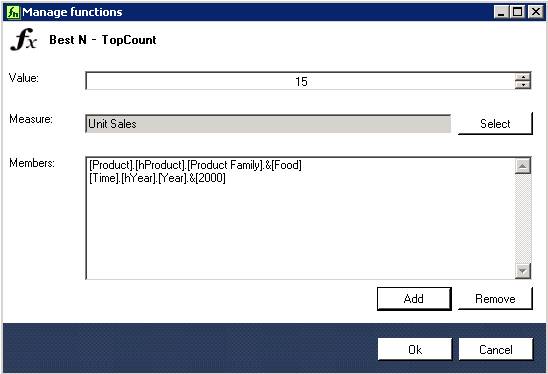
Best 15 Cities (TopCount 15) only for year 2000 and for Product Family Food
Dialog will appear:
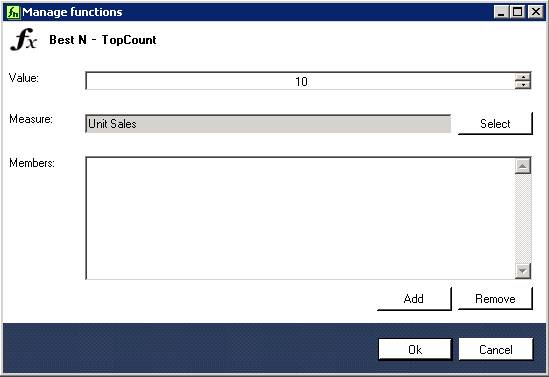
§ set appropriate value
o in our case 15 instead of 10
§ define measure if selected one is not suitable for you
o we will leave Unit sale
Ø to select another measure, just click button Select
Ø select from dialog new measure
Ø select Ok
§ define members to create tuple inside function to define more precisely
"for what" we are searching top 15 cities, in our case
o select button Add to add Year 2000
Ø find member Year 2000
Ø select Ok
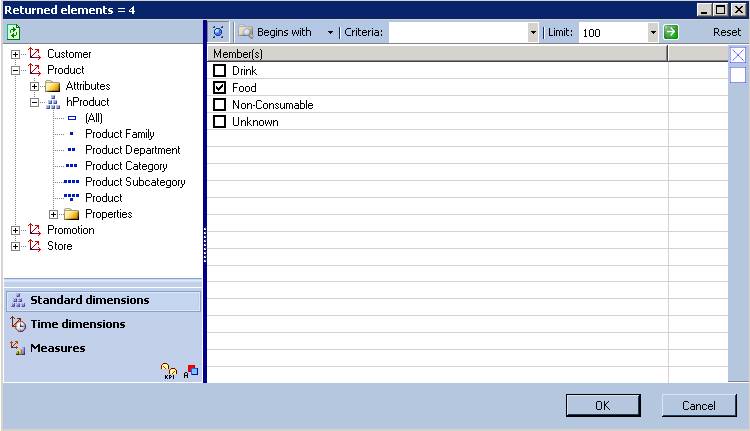
o select button Add to add Food
Ø find member Food
Ø select Ok
· select OK
Example of member search dialog used to search for members inside hierarchies:
When we set all parameters as we agreed, dialog will look like this:
After confirmation result is:
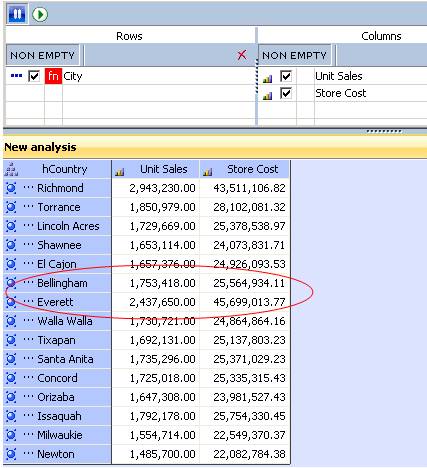
NOTE: You may notice
that result for
How is that? This is not what we expected. This is due to the fact that
set of 15 cities (in rows) is set of Best 15 cities in year 2000 and for Food.
However we are not looking that at result table. At result table we are looking
Best 15 cities for Year 2000 and Food and their result for All Year, since we did not
specify in rows or in columns we would like to see Year 2000 and Food.
Therefore do not forget, to set use correct MDX
command to obtain expected
results (what you asked for) adding members Food and Year 2000 for example in column
area.
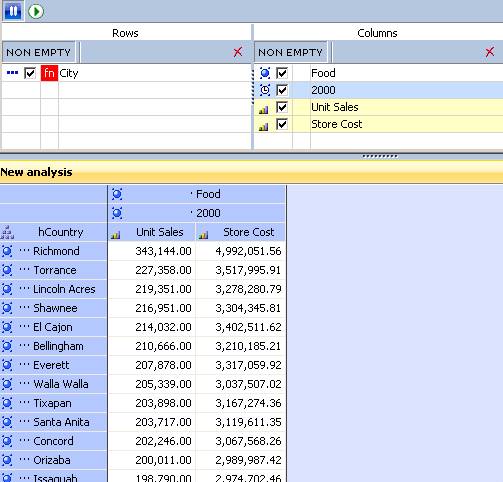
Now you are looking at the correct (better to say expeceted) result.